


Who are our Gen Z Students?
What can we learn about our students from Generational Data?

I will be the first to admit I am typically not a fan of stereotyping by generation. Most of these stereotypes are negative (think about the word boomer) and generations are obviously far too large to provide us information on any one specific person. With that being said, it can provide us information on what to expect from a large group as a whole. If we want to best reach out students (and integrate AI) we must, as educators, understand our students.
Introduction

Perhaps the most difficult part of understanding this data is sifting through what is truly new or unique, what is the continuation of a current trend, and what is simply age based. The meme above demonstrates one of the major hurdles people must overcome when thinking of any younger generation. The meme shows that, as early as the 1890’s, nobody wanted to work anymore. The sentiment that kids do not want to work, have gotten soft, are not ready for the real world, and so one has existed for 150 years. I would guess none of us would think about the 1890’s and feel that they had it so easy back then that everyone went soft. Is it really different today? While you read this post ask yourself, is this unique? Is this the continuation of a trend? Is my initial reaction based on anecdotal evidence or bias?
Warning: Although not discussed in detail, some of the charts and topics include references to sex, drugs, alcohol, self-harm, and suicide
Background
Before we can do a deep dive into the social, economic, and mental well being of gen z, we have to define who exactly we are talking about.

As someone born in 1991, I am firmly in the Millennial generation. Not everyone is so lucky to be neatly defined into a generation. As you will see in some of the charts used below, not everyone agrees on the exact cut off date for generations and depending your location and upbringing you may better identify with one generation over another. Most researchers designate Gen Z as starting at 1996 though the exact date will range from 1994 to 1998. As a result, those born in this time range can find themselves struggling to identify with a specific generation (and sometimes are not accepted by a generation). In this article, we will assume the cut off is 1996 meaning the oldest Gen Z adults are 28 and the youngest children are 12 (based on a 2012 cut off). Those born after 2012 are currently called Generation Alpha (sometimes referred to as Polars).
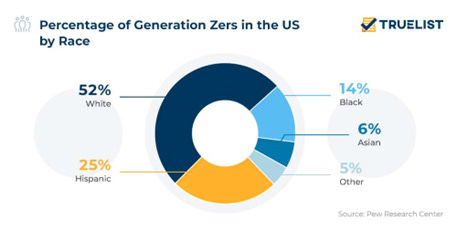
As has been predicted for a long time, America will eventually be under 50% white. Although Gen Z has yet to reach that mark, 52%, they may be the last. Polars currently are right at 50% as our country continues the trend of being a melting pot. Although this certainly varies based on where you live, with Gen Z having greater access to online resources than we did as children, they are more aware of this fact that any generation prior to them.

Another trend that has continued are adults who identify as part of the LGBTQ+ community. I remember being told as a college student that 1 in 20 adults were a member of this community (although not referred to as LGBTQ+ at the time) which, based on the data at the time was accurate. However, as the community has become more accepted and it has become socially safer to come out, the number has grown. This is particularly true among Millennials and Gen Z. For our Gen Z students (in this case young adults) 1 in 5 students identify as part of the LGBTQ+ community. This includes 2.25% identifying as Trans and 3.25% identifying as nonbinary (U.S. Census Bureau). To date, there is no relationship between being part of the LGBTQ+ community and religion, political affiliation, or where you live.

Lastly, as we consider some basic background information, I think it is important to consider how Gen Z views the role of the government. This is a trend that closely follows both generation and age. It is no coincidence that every generation has led protests and tend to do so at teens and young adults. Gen Z believes the government should be doing more to solve society’s problems. This belief will show up again in some of the other trends we discuss.
Our basic initial takeaways as we consider the social, emotional, and mental aspects of Gen Z? This generation is currently between the ages of 12-28. They are the most diverse generation to date and this includes both by race (52% white) and by sexual identity (20% LGBTQ+). Overwhelmingly, Gen Z believes the government should be doing more to solve problems and typically these are problems that plague those with less of a voice.
Social Changes
People are quick to point out that Gen Z needs to “touch grass.” Older adults languish that Gen Z are always on their phones, computers, tablets, or gaming device. Despite being the most connected generation of all time (as it pertains to social media and smart phones), Gen Z may be the least socially connected group yet.

High school students are participating in less social behaviors and this is a trend that has been taking place since Gen X was in high school. Some studies label this is “risky” behavior while others refer to it is “adult” behavior. I will only be referring to it as social behavior as I am not sure either is appropriate for all categories discussed. As you can see in the graph, in the 90’s four in five high schools used alcohol which has dropped to 3 out of 5, a significant change. This change is even more drastic when it comes to cigarettes (3.5/5 to 2/5) and sex (2/5 to 1/5). Regardless of your views of teens participating in alcohol, cigarettes, and sex, they are typically social behavior. Their drop would suggest high school students are spending less time together (at least in person).
This finding is supported by the fact that high school students since 1990 are 30% less likely to have worked for pay and 31% less likely to have a drivers license by the age of 18. Both are pro-social behavior. You can certainly argue that working is social but, in my experience as a teen, the reason you work is to have money to participate in social activities with your friends. Meanwhile, the idea of not wanting a drivers license immediately at 16 is bewildering to me. However, if students are not leaving their house as frequently and less likely to participate in social behavior, the “need” for a license is less pronounced.
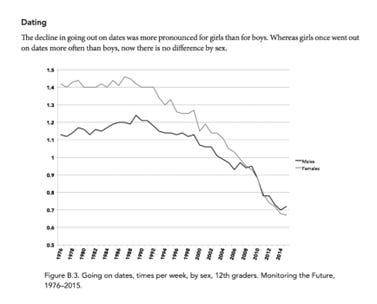
Meanwhile, as the rate of sex among generations in high school has dropped, the dating rate has absolutely plummeted. For decades, the dating rate remained consistent with females averaging more dates than males but both experiencing minimal change up to the year 2000 (10% for males and 18% for females). As millennials enter high school the trend changes and dating rates decline and that has continued as Gen Z enters high school. Over the next 24 years (not completely shown in the chart), dating rates have dropped 33% for males and 48% for females. The result is a change from approximately 1-1.5 dates per week to 0.5 dates per week or 1 date every 2 weeks (5 dates a month to 2 dates a month).

You may find yourself with mixed feelings regarding teenage and young adults participating in drugs, alcohol, sex, and dating. Certainly it shows anti-social behavior but most people would argue less drug use and smoking as a net positive. However, even social behavior that many might consider a positive is trending downward and that is regardless of age. In the graph above are the percentage of each generation that do not identify with any religion. As you can see this has increased with each generation. Perhaps more surprising, is that each generation, as they are getting older, are moving away from religion. As people get older they tend to become more conservative. However, despite this being the trend, that has not led to increased religious rates. Gen Z has continued this trend with nearly half not participating in a religion. Regardless of view, religion is a large social outlet for many people.
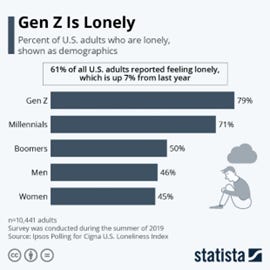
With the data that has been provided so far, the following should not be a surprise. Gen Z is lonely and more so than other generation. I have decided to take data collected in 2019, noting this is prior to the COVID-19 pandemic. The evidence out since this time suggests that this trend has continued and amplified as a result. This has gained some traction in mainstream and social media and may be one of the most important issues that need to be addressed in the coming years.
Nearly 80% of Gen Z reports feeling lonely and 71% of millennials feel the same way. On top of that, 22% of Millennials report having no friends while only 9% of Boomers report feeling the same way (Resnick). From 2012 to 2019, socialization among teenagers dropped by an average of 152 hours per teen per year (approximately 30 minutes a day). This amount has increased since the pandemic (Aguiar et al.). The year 2012 is a significant year as it is when the eldest Gen Z turned 16 and also when smart phone ownership passed 50%. The sharp increase in loneliness has more commonly been referred to as the “loneliness epidemic.”
Mental and Emotional Health
The health of Gen Z and to a large extent Millennials has suffered as a result of this loneliness epidemic.

The data in the chart should be nothing short of terrifying and requires immediate action. Unless you are an elementary school teacher, your student body is Gen Z. Even here at Columbus State Community College where I have students ranging from 16 to middle age, 90% of my students are Gen Z. This means in any given classroom in this country, 3/5ths of your students are feeling anxious or nervous, 2/5ths are feeling depressed or hopeless, and 1/5th has had thoughts of self-harm. If you are curious why some students are struggling academically or with their attention you may not need to look much further.

Meanwhile, and further supporting the data from the previous chart, less than half of Gen Z reports having good mental health. Although there is a relationship between age and mental health, generations tend to experience greater mental health as they get older, Gen Z lags behind the other generations at the same age. Some of this stress, anxiety, and poor mental health most likely stems from world or national news as Gen Z is more likely to be stressed about major events.
Every indicator we have shows that mental health and psychological well-being has become more negative among teens and young adults since 2012. As of 2020, 1 in 5 12th graders report not being satisfied with themselves and 1 in 2 feel they cannot do anything right (Monitoring the Future). There is no doubt this, to some extent, has to be due to the fact that people are simply more likely to report mental health issues and seek out help. However, if this was true (or at least most of the explanation) we would expect that self-harm and suicide rates would not change. In fact, if the same number of people were depressed but more were getting help we would expect to see suicide and self-harm rates fall. Unfortunately, this is far from the truth. Since I graduated high school in 2009, self-harm rates are up 400% and suicide rates have doubled (CDC).
Contrary to what some politicians may want you to believe, this is not an American phenomenon. America does not have a higher percentage of its population with mental health issues nor has it gotten substantially worse than any other country. The increase in loneliness, depression, and suicide has increased worldwide (at least in countries with reliable data). This requires looking for a world event that took place around this time that would potentially explain such a change. As mentioned previously, many scholars are associating smart phones and social media use with poor mental health as there was a rapid change between 2009 and 2012. Prior to 2009, less than half of teens used either one. By 2012 half of teens had a smart phone and over 75% were on social media (Monitoring the Future, Atlantic).
Scientists tread carefully in this category as correlation does not mean causation. The correlation between smartphones and social media and poor mental health among teens and young adults are there. Whether or not one causes the other is still up for debate, though it seems to be becoming harder to debate. Studies have shown the negative impacts Instagram has on teenagers and young adults, particularly teenage girls. Some of these studies have even been done by Meta (owner of Facebook and Instagram) and despite their attempts to hide the results, the data has become publicly available. Regardless of the reasoning, which is not the point of this article, mental health has suffered significantly in the last 15 years.
Implication on Education
Gen Z is continuing the trend of valuing education and feeling they “need” a college degree.

This trend has taken place since the silent generation with 1 in 3 millennials having a bachelors degree (U.S. Census Bureau). Although almost all of us agree that college is not for everyone and plenty of successful people do not attend college, the socioeconomic results suggest differently. Income inequality between those with a 4-year degree and those without has continued to grow which, unfortunately, supports the pressure Gen Z feels to attend college.
As much as Gen Z feels pressure to attend college, they also feel they belong in college. In 1976 just 56% of 12th graders believed they were of above average intelligence. Today that number is 78% (Monitoring the Future). To some extent, these students are given feedback that supports this conclusion. During the same time span the percentage of students receiving an A average their senior year ballooned from 20% to 40% despite less homework being required during this time. This increase in A average and perceived intelligence has not been matched by standardized test scores that have remained relatively unchanged. Essentially, Gen Z students are more likely to feel they are of above average intelligence, receiving the grades to support this assertion, despite test scores that suggest they are no more or less intelligent than any prior generation.
This belief of being above average and being an A student leading into college could explain the defense mechanisms we are more likely to see as educators. Gen Z believes the cards are stacked against them. In the last 10 years, the percentage of 12th grade girls that believe women are discriminated in college jumped from 25% to 57% (Digest of Education Statistics). In that same time, the percentage of 4-year degrees going to women has remained steady at 57% and the percentage of law and medical degrees going to women passed 50%. This is not to argue that women do not experience discrimination, however, while things have improved (and women receive over half of all degrees) there has been a huge increase in the feeling of discrimination.
The feeling of discrimination could be tied to the increase in external locus of control among generations. Locus of Control tends to be a powerful predictor of outcomes and Gen Z is 20% more likely than Millennials and 30% more likely than Gen X to have an external locus of control. An external locus of control meaning you feel things are beyond your control while an internal locus of control would be feeling the things that happen to you are within your control. People with an internal locus of control are more likely to behave in healthy behaviors, suggesting that Gen Z’s higher external locus of control could be negatively impacting their behavior (and probably a partial explanation for their poor mental health).
As a result of these feelings of hopelessness, discrimination, and external locus of control, Gen Z believes college should be a safe space. Vernacular like “safe space” and “trigger warning” hardly existed 10-20 years ago. In that time span, the phrase “safe space” has increased 600% in literature (Google Books Database). In an effort to make college “safe” Gen Z is twice as likely to believe college should ban extreme speakers than Gen X and 25% more likely to believe colleges should prohibit racist and sexist speech (American Freshman Survey). Likewise, 40% of Millennials and Gen Z believes the government should prevent people from making offensive statements (Katz et al.). Gen Z and younger Millennials are on board to prevent or limit speech, particularly on college campuses, to make for a safer environment for all people.
What Can Educators Do?
I threw a lot of data and figures at you and you may be wondering what to do with it all. Does this have any implications for us as educators or even for our students? I believe the answer is a resounding yes! Although in many cases Gen Z has followed the trends set by previous generations, there are still some important differences we must consider to effectively educate today’s youth. The better you know your students, the more impactful you can be as an educator.
Based on all the data compiled, below is what you can expect in an average class of 25 students:

It is important for us as educators to realize that when we walk into a classroom, we will be, nearly every time, standing in front of LGBTQ+ students, students struggling with mental health, students contemplating self-harm, students who potentially have transportation issues, and the list goes on. As a result, it is important to make our classroom safe and inviting for all people. There are some relatively simply techniques to accomplish this goal.
1. Create a Safe Space
The first is easy, use pronouns. You do not need to use them literally every time someone speaks to you, but using them when you first introduce yourself, including them in your email signature, and providing a safe way for students to provide their pronouns are all easy options to make your classroom a little safer. Remember, in every class you have there is, on average, 1 student who is trans or non-binary.
A little more challenging is highlighting marginalized groups in your field. This may require some initial research (hence the less easy part) but is very much worth it. The field of science, much like many, has been dominated by white males throughout history. However, with some research you can find scientists from marginalized groups, including women, LGBTQ+, and a variety of races and ethnic groups. It is important to show to your students people that represent them in the roles they aspire to fill someday. In a classroom that is half minority students, half female, and 20% LGBTQ+ it is important to show successful people that represent them.
Additional ways to create an uplifting environment in the classroom is by making the space collaborative and encouraging students to work together and facilitating those discussions. Although this can be difficult, many students feel alone and providing a space for them to build a connection is important. On top of this, it can assist your classroom as studies show that students who have at least one connection in the classroom are less likely to fail. Finding ways to celebrate student successes, allowing them to share small personal victories, and emphasizing mental and emotional health are also important ways to create a better space.
2. Create Clear Expectations
An underappreciated aspect of creating a safe classroom is creating a fair classroom. One with clear expectations where students see the rules applied evenly among all students. This is particularly true because today’s students go into college with different views and expectations than previous generations. 2 out of 3 students believe professors should raise their grade if they explained they were trying hard. 1 in 3 students believe they should receive at least a B if they attended most of their classes (Greenberger et al.). Providing a safe classroom does not require us to lower our expectations but does require us to make them clear.
Setting expectations and establishing clear guidelines begins with the syllabus. Outlining exactly what is graded, why it has the point value it does, and what opportunities there are and are not to improve a grade is important. Providing transparent grading through rubrics and examples of A verses C quality work also assists with establishing fairness. In my classroom, I have never offered bonus points and I stick with that. It may disappoint some students but I have never had any issues because it is applied fairly.
I also, as stated in the syllabus, drop a students lowest homework score, quiz score, and lab score. One of each. This assists with students mental health as they have some flexibility with this dropped grade. It can be saved until the end and their lowest grade is dropped. However, should they reach a point where they are overwhelmed, a student could take an assignment off. It also gives them a free pass should they miss a deadline or forget something. It has been useful for my own mental health as well. Instead of debating what is excused versus unexcused, I simply refer students to the syllabus and explain that they do not need to stress about the missing assignment as it is essentially their freebee. It will be removed at the end of the semester.
Conclusion
The more things change, the more they stay the same. It is too simple to make assumptions about today’s youth and blame “kids these day.” Much of what we see is the result of trends that have been taking place for decades or even centuries. On top of this, the culture of giving A’s out more frequently has been established by teachers from the Boomer and Gen X generations. Regardless, our job as educators is to maximize the growth of our students. In order to establish this, we need to know who are students are, meet them where they are, and create a classroom that allows for learning. To do this requires clear expectations, a safe environment, and one that celebrates everyone from all walks of life.